A Useful Way To Know When Stocks Are Overbought Or Oversold
In previous articles, I’ve explained the role that relative strength (RS) plays in my Maximum Profit system. I’ve even showed readers how to calculate it — even though my system does it for us (among several other things).
But one of the most common questions I get from readers goes something like this:
What’s the difference between relative strength (RS) and the Relative Strength Index (RSI)?
So I want to address this today.
RSI is one of the most popular technical indicators out there. Many individual traders add RSI to a price chart and use it to help them analyze the market. RSI is used to spot when a market has gone too far, too fast. (RS, on the other hand, is used to identify stocks that are following well-defined trends.)
What Is RSI?
RSI was introduced by J. Welles Wilder, Jr. in his 1978 book, “New Concepts in Technical Trading Systems.”
The theory behind RSI is that it will identify those times when a stock has moved too far, too fast and is due to reverse its current trend. RSI is intended to spot tops and bottoms rather than find stocks that are starting to move higher for an extended period, as RS seeks to do.
RSI is used to spot oversold and overbought markets. When traders say that a market is oversold (having fallen too fast) or overbought (having risen too fast), they are suggesting that market action will behave much like a rubber band that’s been stretched too far and is about snap back.
Of course, markets that have moved quickly in one direction can continue moving in that direction. Oversold markets do show a tendency to become more oversold, just as overbought markets tend to become more overbought. This is why trend-following systems and indicators, such as RS strategies, tend to work over the long term. Despite these facts, RSI remains popular among investors who believe the indicator can help them predict market reversals.
How Traders Use RSI
To calculate RSI, the following formula is used:
Any time frame can be used to calculate the average gain and loss in the RSI formula, although 14 days is usually used (this is the default option if you look at RSI in stockcharts.com, for example). To find the average gain, the gains on up days are added together and divided by the time frame (in this case, 14). Conversely, to find the average loss, the losses on down days are added together and divided by 14.
RSI can be calculated for any stock, mutual fund or ETF. This indicator can also be found for futures contracts and foreign exchange markets.
Because of the way RSI is constructed, the value of this indicator will always be between 0 and 100.
Traders usually use RSI to spot oversold market conditions when RSI falls below 30 and overbought market extremes when RSI is above 70. Since markets can remain oversold or overbought for extended periods of time, it is usually best to wait for the indicator to reverse before entering a position. An example of this technique is shown below.
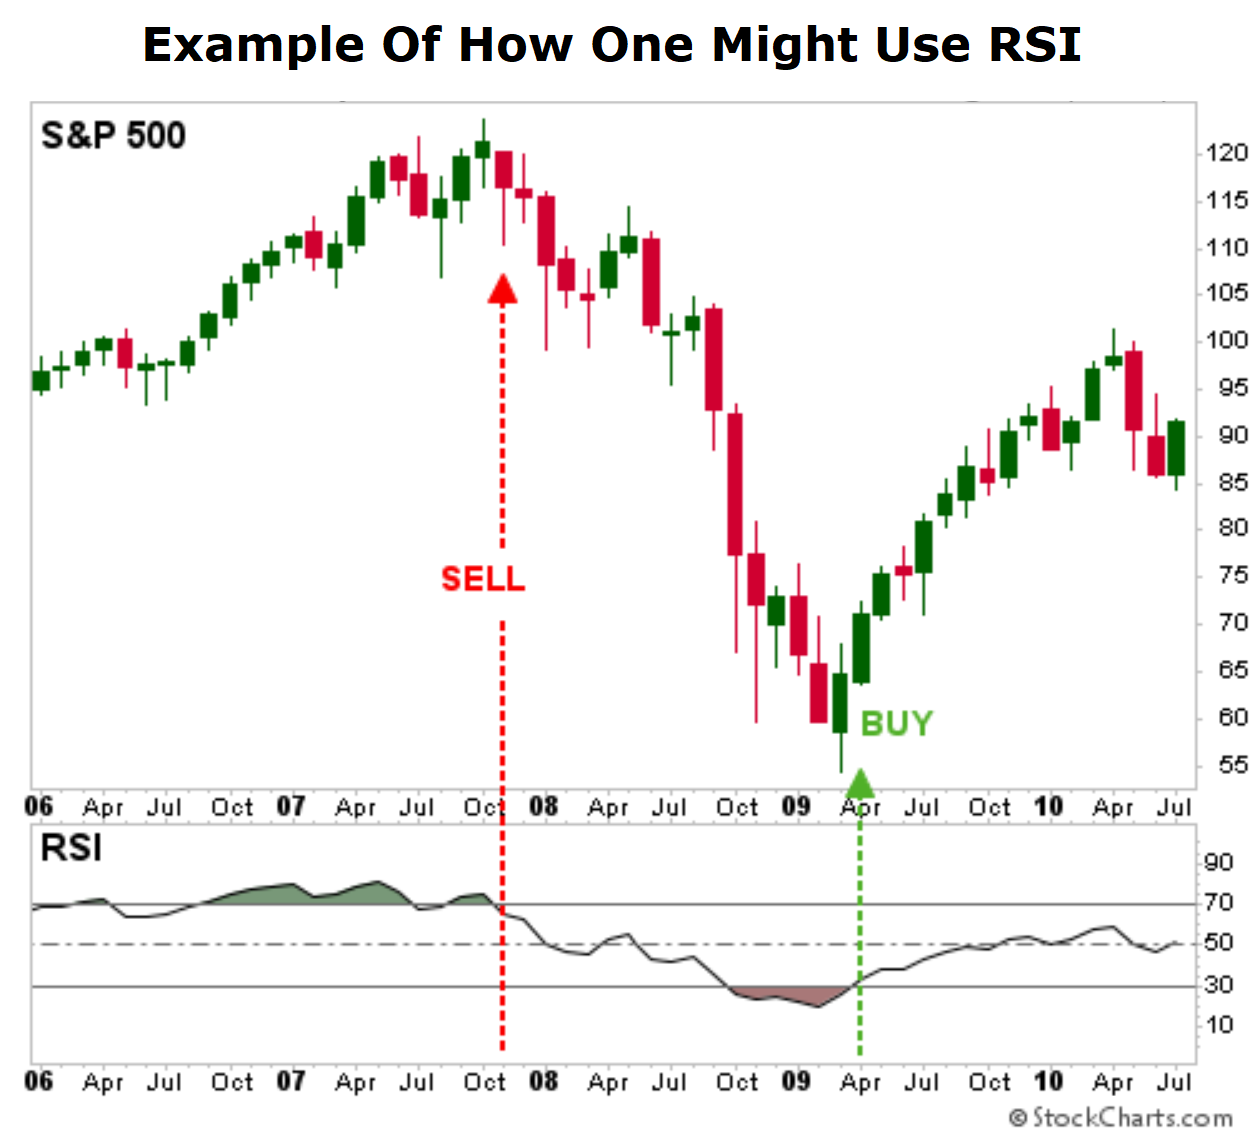
The example shown for the SPDR S&P 500 ETF (NYSE: SPY) is based on monthly data. RSI provided a timely sell signal near the top in 2007 and a buy signal that allowed traders to buy near the bottom. Keep in mind that this is a well-selected example, and most signals will not be this timely.
Why RSI Matters To Traders
Some technical indicators can become self-fulfilling in their own right. By that, I mean that their own popularity can move markets, regardless of whether or not they have any merit. This may be the case with RSI — but in reality it doesn’t really matter.
Just know that RSI is not RS (relative strength), and the two should not be confused…
The point, however, is that RSI can be a useful indicator. If many traders spot an overbought/oversold signal in RSI, a quick price move could follow.
P.S. I just released another BIG prediction about cryptocurrencies…
My team and I think cryptocurrencies will surge again in the coming months. But here’s the thing… the big winner won’t be Bitcoin, Binance, or Ethereum. While those cryptocurrencies could do well, we think there’s another one with a lot more upside potential for new investors. It’s 321 times faster than its prime competitor and could surpass it in value…
Learn more about our “shocking” investment predictions for 2022 right here.